Investigating the Consumers’ Buying Behaviors via adopting the decision-making tool “Six Thinking Hats”
Marzia Dulal1*, Mohammad Shayekh Munir2, Nuzat Tabassum3
Assistant Professor, Department of Textile Engineering Management, Bangladesh University of Textiles
Assistant Professor, Department of Textile Engineering Management, Bangladesh University of Textiles
Research Student, Department of Textile Engineering Management, Bangladesh University of Textiles
Abstract: 👇
This study presents an implementation of the decision-making tool “Six Thinking Hats” for individuals buying decision-making. The main objective of this research is to segment our consumers into six categories, each having a distinct personality and characteristics. The method is called six thinking hats, and by finding out the percentage of the consumers how sellers, retailers can pursue them. The study was done with quantitative data and qualitative interpretation and had done a survey. The target population was between 20-30 years old. This survey shows that our customers now make an informed decision. The technique helps individual consumers adopt various viewpoints, deepening their thinking and potentially encouraging new solutions. An individual consumer “wears” each hat in turn, thoroughly investigating the mode of thinking it represents. Then they move to the next. Thus, the prominence thinking findings can help retailers identify how consumers’ categories and make promotional and selling techniques accordingly.
Introduction:👇
Bangladesh’s export in the textile sector is continuing to decrease. According to the Export Promotion Bureau (EPB) data published on 7 November, year??, earnings from RMG export performance (Goods) for FY 2019-20 July-October fell by 6.67% to $10.57 billion from $11.33 billion in the same period of FY19. Income from woven garments fell by 7.67% to $5.03 billion in July-October of FY20 from $5.45 billion in the same period of last fiscal year. In contrast, knitwear export fell by 5.73% to 5.53 billion from 5.87 billion [1].
Our GDP and GNP depend much on the earning of our Ready-made garments sector. And when we see that the making of the industry is hampered, or decreased than expected, then the whole country and its economic condition experience the ripple effect [2]. To keep our economic backbone study, we have to ensure that the customers are always happy with the apparel products they buy from here. This study works to find out what the consumers want, what they want, when, where, how they want their products delivered to them, and how they satisfy their needs.
This study works to segment every living person in one of the six thinking hats. And understand with that one-of-a-kind personality, their traits, their anticipation about their product and how that product satisfies their need along with marketing strategy needed to reach to the consumers in a manner they want with maximum efficiency and full practical use of resources.
Six Thinking Hats is a system represented by Edward de Bono, narrating as individual thinking involve six colored hats. Six Thinking Hats and the associated idea of parallel thinking give an insight of thinking processes descriptively and cohesively [3].
Six Thinking Hats or Edward de Bono’s Six Hats is an innovative decision-making technique and method for group discussions and individual thinking when it merges with a parallel thinking process. Six thinking hats help groups think more effectively. It is a means to develop thinking processes in a detailed and cohesive manner [4].
Edward de Bono is the founder of this ‘six thinking hats’ process and wrote a book about the Six Thinking Hats in 1985. Assuming that is a metaphor for a particular Way of thinking [5]. By inwardly wearing different thinking hats, people are forced to look at a problem from different positions. Thus, a one way of thinking is excluded, and new insights are created. He differentiates six different frames of mind in which the brain can become sensitive. Each of these mind frames can be found in the brain and develop conscious thoughts for certain aspects of the issues discussed here (e.g., gut feeling, pessimistic views, neutral facts)[6].
Literature Review:👇
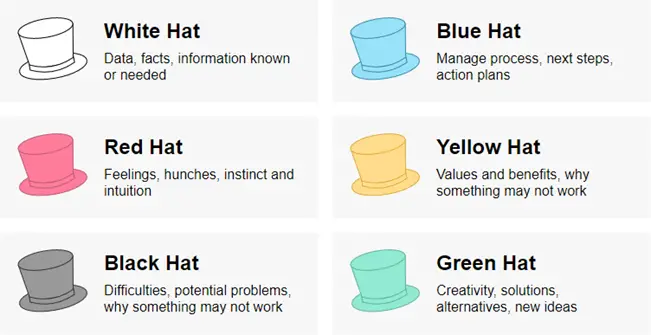
The six different frames of mind (six thinking hats) are found in the shape of a hat, and each of the hats is a different color [7]:
White: Information: consider only available information; what are the facts?
Red: Emotions: intuitive reactions or expressions of feelings (but no justification required).
Black: Judgment: logic applied to identification of mistakes or barriers, looking for a mismatch.
Yellow: Positive view: logic applied to the identification of opportunities, looking for harmony.
Green: Creativity: statements of goading and investigation, hearing what an idea is.
Blue: Thinking: thinking about thinking.
The colored hats are used as metaphors for the various states of mind. Switching to a specific type of thinking is exemplified by wearing a colored hat, literally or metaphorically. These six thinking hats metaphors provide complete and comprehensive segregation of the thinking types than the prejudices inherent to people’s immediate thoughts. These thinking hats help people feel more deeply about a particular topic [8].
There have been many theories about consumer segmentation, consumer theories, and decision-making tools both for consumers and sellers. The six thinking hats can be utilized in all of these, providing the perfect way to reach every possible and potential consumer, and influence them into buying apparel products.
The need for using a new theory like six thinking hats has emerged because of our seller’s changing buying pattern, of whom a significant percentage resides in Europe and the USA. Europe’s economy is slowing down. According to the preliminary Eurostat data, Eurozone GDP grew by 0.2% quarter-on-quarter in the April-June period, down from 0.4% in the previous three months. Consumer price growth decelerated. Year-on-year inflation in July was 1.1%, down from 1.3% in June. That means that the Eurozone inflation was 17-month low and far from the European Central Bank’s target of close but below 2%.
Europe’s downhill economic condition, Brexit (Britain out of EU) and the USA s political instability, and economic dive by cutting down federal employees’ salaries, with the high unemployment rate and the slow growth of consumers. As the root cause is consumers changing behavior towards buying, the goal is to attract and reach every consumer to influence them to purchase apparel products [9].
Six Thinking Hats is a system developed by Edward de Bono, based on this system a conceptual model is outlined (Figure 2) which traces solitary thinking involving six colored hats in a straightforward and bonded way [10]. It should be taken in mind that, although every person has all of the six hats and eventually uses all of the hats in terms of facts, feelings, cautions, process, benefits and creativity, there will be prominence in the person during purchase.
The study done targets to research on them. An individual consumer takes purchase decision based on these six hats by which seller can identify the consumer buying pattern as well as can find which category of thinking is prominent in the market.
Figure 2. Conceptual Model of Finding the prominence of hats
Specific Objectives:👇
To segment people into six personalities
To see the percentage of consumers of the hats or personalities
To see how people choose their thinking hat, and assess the ordinal way of selecting the hats.
Research Questions & Illustration:👇
There are 7 Research Questions for finding the prominence of Consumer Decision Making according to Six Thinking Hats. Under each question, there have six statements that signify the six colors of hats. The questions are:
What types of writing on T-shirts do you like?
For buying a pair of converse shoes, what do you focus on?
What do you feel about the changes in fashion trends?
Suppose you want to buy a bed sheet, and in a shop, you see a bright color bed sheet, what do you think?
When you watch a TVC or Advertisement of a garment’s products, what comes to your mind?
After buying attire which position do you find yourself in?
What about online shopping for dresses, T-shirts, etc., you think?
The following framework is given as an example to show how will be the six thinking hats model for research question 1.
Figure 3: Framework of Six Thinking Hats for Consumers
Methodology:👇
This survey’s primary goal is to identify that most people were wearing their respective thinking hats that define their personality, thinking pattern similarity, mutual characteristics, and the decision-making process. The methodology is the foremost approach to identify which hat is worn by how many people. Researchers did this survey with 290 people. This study was investigative research because no research on this topic covered the geographical area here covered. In this investigation, primary data were collected through a questionnaire survey covering 290 people aging between 20-30 years who are the largest consumer fragment in Dhaka City in Bangladesh. The survey method was done in Multiple Choice Questions (MCQ).
The sampling technique used random sampling technique and selected 290 people from different universities by distributing Survey monkey and Google Forms as questionnaires. Primary data was collected with the close-ended questionnaire and secondary data from websites and other related books. The questionnaire was used to collect data and analyze those data by scaling technique. Graphs were used to identify the no. of people wearing their color of thinking hats, and the priority of their thinking hats, and which hats they use after which hats or the manner of their using of thinking hats to understand the ways to understand their personality and their way of liking the marketing approach they like that reach their minds.
Results:👇
For surveying Multiple Choice Question (MCQ) style, seven questions were asked by fieldworkers to consumers. Each has six options that signify each hat.
Table 1: Percentage of Respondents of question 1 (Q.1 What types of writing on T-shirt do you like?)
Options
Everyday problem quotes
Thoughts that may you think
Out of the box quotes
Trendy topics
I like the brand name.
Motivational quotes
Options signify the hats
Black
Blue
Green
Red
White
Yellow
Grand Total (%)
Female (%)
4.55
15.15
6.57
2.02
5.05
6.57
39.90
Male (%)
10.61
17.68
13.64
3.54
9.60
5.05
60.10
Grand Total (%)
15.15
32.83
20.20
5.56
14.65
11.62
100.00
Here the option “Everyday problems quotes “means Black Hat Thinking. They are cynical and see the faults in everything. The option “Thoughts that make you think” means Blue Hat Thinking. Because people with blue hats are the hats that are always looking for ways to think, they are the overseers. They need seeds for thinking. The option “Out of the box quotes” means Green Hat Thinking because people with green hats are creative and always look for out-of-the-box ways or looks for their products.
The option “Trendy topics” refers to people who are of red hats. These are people who are emotionally and always trying to connect with something. The option “You like the Brand name” means White Hat Thinking They want their need to fulfill and nothing more. The option “Motivational quotes “indicates Yellow Hat Thinking. They see the best qualities in everything.
In this particular question, people answered in favor of black hats was 15.15%(30 out of 198), Blue hats were 32.83% (65 out of 198), Green hats 20.20 ( 40 out of 198), Red hats 5.56% (11 out of 198), White hats 14.65% (29 out of 198), Yellow hats 11.62% (23 out of 198).
In this case, by most people wearing the same hats, the sequence from first to last was: Blue, Green, Black, White, Yellow, and Red.
Table 2: Percentage of Respondents of question 2 (Q.2 For buying a pair of converse shoes, what do you focus on?)
Options
I think they will get dirty easily.
Compare their comfort, price and look.
I will buy other shoes at a cheaper price.
I think they will get dirty easily
Ask friends and salesperson (comfort, long lasting, suggestion)
Everyone is using them (thus very trendy)
Options signify the hats
Black
Blue
Green
Red
White
Yellow
Grand Total (%)
Female (%)
1.01
31.82
.51
4.55
1.52
0.51
39.90
Male (%)
1.01
42.42
4.55
3.54
7.58
1.01
60.10
Grand Total (%)
2.02
74.24
5.05
8.08
9.09
1.52
100.00
The option “You think they will get dirty easily “means Black hats. They are cynical. And see the faults are the first thing they see. The option “Compare their comfort, price and look” means Blue. Because people with blue hats are the hats that supervise everything else and every other hat, they are the overseers. Here the option “I will buy other shoes at a lower price” means Green because people with green hats are creative and are always looking for an alternate way to buy their products.
The option “You think they look good” refers to people who are of red hats. These are people who are emotionally and always trying to connect with the product. If the shoes look good on the person, they are bound to buy them. The option “Ask friends and salesperson (comfort, long-lasting, suggestion” means white hats. They look for information. The option “Everyone is using them (thus very trendy) “indicates yellow hats. They see the best qualities in everything.
In this particular question, people answered in favor of black hats was 2.02% (4 out of 198), Blue hats were 74.24% (148 out of 198), Green hats 5.05% (10 out of 198), Red hats 8.08 % (16 out of 198), White hats 9.09% (18 out of 198), Yellow hats 1.52% (3 out of 198).
In this case, most people wearing the same hats the sequence from first to last were: Blue, White, Red, Green, Black, and Yellow.
Table 3: Percentage of Respondents of question 3 (Q.3 What do you feel about the changes in fashion trend?)
Options
Against it.
I prioritize advantages and problems.
Generate other ways to deal with it
I let my gut feelings, and do what it says
See the change as it is.
I see the bright sides of it.
Options signify the hats
Black
Blue
Green
Red
White
Yellow
Grand Total (%)
Female (%)
0.51
12.63
4.55
10.61
4.04
7.58
39.90
Male (%)
1.01
20.71
9.09
6.57
9.60
13.13
60.10
Grand Total (%)
1.52
33.33
13.64
17.18
13.64
20.71
100.00
The option “Against it “means Black hats thinking. They are cynical and see the negative sides in everything. The option “I prioritize advantages and problems” means Blue. Because people with blue hats are the hats that plan and make a rational decision, they are the overseers. They think, compare, plan and do. Here the option “Generate other ways to deal with it” means Green because people with green hats are creative and always look for an alternate way. If not found, then generate one.
The option “I let my gut feelings, and do what it says” refers to people who are of red hats. These are people who are intuitive and emotional. They don’t think ahead. The option “I see the bright sides of it “indicates yellow hats. They see the best qualities in everything.
In this particular question, people answered in favor of black hats was 1.52% (3 out of 198), Blue hats were 33.33% (66 out of 198), Green hats 13.64% (27 out of 198), Red hats 17.17% (34 out of 198), White hats 13.64% (27 out of 198), Yellow hats 20.71% (41 out of 198).
In this case, by the majority of Number of people wearing the same hats, the sequence from first to last was: Blue, Yellow, Red, Green, White, and Black
Table 4: Percentage of Respondents of question 4 (Q.4 Suppose you want to buy a bed sheet and in a shop, you see a bright color bed sheet, what do you think?)
Options
Maybe it’s too bright with my personality
Will this go with everything else in my room?
I buy something else instead
It looks really nice. I will buy it no matter what.
You think anything soft will do.
This will brighten my room.
Options signify the hats
Black
Blue
Green
Red
White
Yellow
Grand Total (%)
Female (%)
5.58
16.75
1.02
2.03
5.08
9.64
40.10
Male (%)
8.63
22.84
3.55
6.60
10.66
7.61
59.90
Grand Total (%)
14.21
39.59
4.57
8.63
15.74
17.26
100.00
Here the option “I buy something else instead” means Green because people with green hats are creative and are always looking for out-of-the-box ways, and as a side effect, can be without focus. As a result, they might be forgetful, fidgety, or overlook the point. The option “Will this go with everything else in my room?” means Blue because people with blue hats are the ones that plan and supervise everything. The option “Maybe It’s too bright for my personality “means Black hats. see the faults in everything. Nothing seems to be up to the mark. The option “This will brighten my room “indicates yellow hats. They see the best qualities in everything.
The option “You think anything soft will do” means white hats. They want their need to fulfill and nothing more. And in the case of a bedsheet, it’s comfortable for them. The option “It looks nice. I will buy it no matter what” refers to people who are of red hats. These are emotional people, and when they connect with a product, they are sure to have it. In this particular question, people answered in favor of black hats was 14.21% (28 out of 198), Blue hats were 39.59% (79 out of 198), Green hats 4.57% ( 9 out of 198), Red hats 8.63% (17 out of 198), White hats 15.74% (35 out of 198), Yellow hats 17.26% (34 out of 198).
Most people wearing the same hats the sequence from first to last were Blue, Yellow, White, Black, Red, and Green.
Table 5: Percentage of Respondents of question 5 (Q.5 When you watch a TVC or Advertisement of a garments products what comes to your mind?)
Options
I hate that part of the tvc
The ad and the product don’t go together
It’s a new way to look at things
I really like how this ad makes me feel
So, there is a new product!
I really like the message of the ad
Options signify the hats
Black
Blue
Green
Red
White
Yellow
Grand Total (%)
Female (%)
6.06
5.05
8.08
4.04
9.60
7.07
39.90
Male (%)
12.12
11.62
9.09
9.60
10.61
7.07
60.10
Grand Total (%)
18.18
16.67
17.17
13.64
20.20
14.14
100.00
Here the option “It’s a new way to look at things” means Green because people with green hats are always looking for out of the box ways or looks. The option “The ad and the product doesn’t go together” means Blue. because people with blue hats are the hats that are always the overseers. The option “I hate that part of the tvc “means Black hats. They are cynical. And see the faults at first.
The option “I really like the message of the ad “indicates to yellow hats. They see the best qualities in everything. The option “So there is a new product!” means white hats. They want their need fulfil and nothing more. The option “I really like how this ad makes me feel” refers to people who are of red hats. These are people who are emotional and the first thing they see is, if they can relate with the product or any means of marketing style the product generates.
In this particular question, people answered in favor of black hats was 18.18% (36 out of 198), Blue hats was 16.67% (33 out of 198), Green hats 17.17% (34 out of 198), Red hats 13.64% (27 out of 198), White hats 20.20% (40 out of 198), Yellow hats 14.14% (28 out of 198). In this case, by majority of Number of people wearing same hats the sequence from first to last were,
White
Black
Green
Blue
Yellow
Red
Here an exquisite data is found, that however, TVC s are always the best medium to reach maximum people more importantly for new products.
Table 6: Percentage of Respondents of question 6(Q.6 After buying attire which position do you find yourself in?)
Options
Nothing seems good enough
What do I pair this with?
If I change this part, it will be perfect.
It looked really good in the shop, but it does not look very good now
Anything that matches the price and me.
I think I have really good taste
Options signify the hats
Black
Blue
Green
Red
White
Yellow
Grand Total (%)
Female (%)
0.51
10.10
1.52
4.04
13.13
10.61
39.90
Male (%)
3.54
8.59
7.07
6.57
21.21
13.13
60.10
Grand Total (%)
4.04
18.69
8.59
10.61
34.34
23.74
100.00
Here the option “If I change this part, it will be perfect” means Green hat because people with green hats are creative. They are always looking for out an alternate way to make things work. The option “What do I pair this with?” means Blue hat because people with blue hats are always supervising. They always have a plan. The option “Nothing seems good enough “means Black hats. They are cynical. And see the faults in everything. The option “I think I have really good taste “indicates to yellow hats. They see the best qualities in everything. The option “Anything that matches the price and me” means white hats. They want their need fulfil and nothing more.
The option “It looked really good in the shop, but it does not look very good now” refers to people who are of red hats. These are people who are emotional and get puzzled by sales persons sweet talks, or by the dazzling light of the shop.
In this particular question, people answered in favor of black hats was 4.04% (8 out of 198), Blue hats was 18.69% (37 out of 198), Green hats 8.59% (17 out of 198), Red hats 10.61% (21 out of 198), White hats 34.34% (68 out of 198), Yellow hats 23.74% (47 out of 198).
In this case, by majority of Number of people wearing same hats the sequence from first to last were, White, Yellow, Blue, Red, Green and Black.
Table 7: Percentage of Respondents of question 7 (Q.7 What about online shopping for dresses, T-shirts etc. you think?)
Options
Too risky
Do I really need to buy this from here?
I will look for a better deal in various apps
WOW! That is a great offer!
I should read the reviews
Well, I can shop while I am lying on my bed rather bargaining and travelling.
Options signify the hats
Black
Blue
Green
Red
White
Yellow
Grand Total (%)
Female (%)
5.56
11.11
3.03
2.02
15.66
2.53
39.90
Male (%)
13.13
12.12
6.57
2.02
20.71
5.56
60.10
Grand Total (%)
18.69
23.23
9.60
4.04
36.36
8.08
100.00
Here the option “I will look for a better deal in various apps” means Green because people with green hats are creative and are always looking for another way. They generate alternatives here, by searching through apps, websites, different digital platforms etc. The option “Do I really need to buy this from here?” means Blue because people with blue hats are the ones who oversee and use other hats. They understand their need first, and pursue the best mean by calculating and comparing. The option “Too risky “means Black hats .They are cynical.
And faults are the first thing they see. The option “Well, I can shop while I am lying on my bed rather bargaining and travelling’ indicate to yellow hats. They see the merits in everything .The option “I should read the reviews” mean white hats. They want their need fulfil and nothing more. The option “Wow! That is a great offer!” refers to people who are of red hats. These are people who are emotional and always trying to connect with something.
In this particular question, people answered in favor of black hats was 18.69% (37 out of 198), Blue hats was 23.23% (46 out of 198), Green hats 9.6% (19 out of 198), Red hats 4.04% (8 out of 198), White hats 36.36% (72 out of 198), Yellow hats 8.08% (16 out of 198).
In this case, by majority of Number of people wearing same hats the sequence from first to last were, White, Blue, Black, Green, Yellow and Red.
Discussion on Six Thinking Hats👇
Even though every people have all the Six Thinking Hats, they all have one hat that is prominent in them. As the objective, that was to find out the no. of people based on their prominent hats, with their prominent hats was found and was expressed in percentage:
Figure 4: Prominent Hat on an individual from six hats
Figure 5: Prominent Hat on an individual in terms of male & female from six hats
And by doing the survey, we found out that most of the female respondents are blue hat thinkers, then white, yellow, red, then green and finally black hat thinkers.
Thus, by the percentage it shows that most of the female respondents are people who are aware of their needs and always assess the need from buying from a certain place, then the largest fragment always wants to know the most about a product, People wearing yellow hats are the ones who always seek the best quality. Than female respondents wearing red hats are people who think from an emotional point of view. The green hat people or the creative geniuses and finally people wearing black hats are the ones who focus on the negative sides of a product. For products it means, most of the female respondents assess the need of the products.
And the second large fragment of the female population , they find the product , and see if the product can fulfil the requirement .For the third largest fraternity are impacted with the good looks or a great advantage that another product of similarity not possess .And the fourth largest population are always trying to find a personal connection with a product , which might even be a personal relationship, or nostalgia , anything that stirs up the feelings. The fifth largest populations are the people who want to stand out in a crowd. They are the people who want to alter a feature, or see if a product can satisfy more than one need. A good example can be and by doing the survey, we found out that most of the male respondents are blue hat thinkers, then white, green, then yellow then black, and finally red hat thinkers.
Thus, by the percentage it shows that most of the male respondents are people who are aware of their needs and always assess the need from buying from a certain place, then the largest fragment always wants to know the most about a product, The green hat people or the creative geniuses. People wearing yellow hats are the ones who always seek the best quality and people wearing black hats are the ones who focuses on the negative sides of a product. Finally, the least fragment of male respondents are people who think from an emotional point of view.
For products it means, most of the male respondents assess the need of the products. And the second large fragment of the male population, they find the product and see if the product can fulfil the requirement. For the third largest fraternity wearing green hats are the people who look if a product can solve more than one need, making it an alternative for other products. They focus on the bright sides, then they focus on the dark sides of acquiring the product. And finally, they see if they can relate to a product. Lastly, people see the worst feature of a product.
Table 8: Comparison of Weighted Rank of color of the hats between male & female
Color of the hats
Male
Female
Weighted Rank
Weighted Rank
Yellow
1
1
Blue
2
3
Red
3
2
White
4
4
Black
5
6
Green
6
5
By cross tabulation we see that, both Female and male respondents are attracted to a product by their best features thus they put on their yellow hats. But from the 2nd hat that the difference begins. In the order of using the hats, male respondents use blue hats thus they think of the necessity of buying the product, the feasibility that lies, all the external and internal products that are dependent on buying of the product. While, female respondents used their red hats, a hat that lets them understands if they can relate with the product.
In the third hat, Male and female respondent switch their hats from their use of their second hats. Thus, male respondents put on their red hat and think from an emotional point of view. While female respondents used their blue hats thus assessing the need for buying the product, the previous experiences, the feasibility that lies, all the external and internal products that are dependent on buying of the product.
While the order of using the thinking hats were assessed, the fourth hat that was used was common in both the genders. Thus, the fourth hat that is used by people regardless of their gender is white hat. And the interpretation of this hat’s usage is that in this stage, people actually want to know the core information regarding the products. How it’s made, if it’s in the matches the price, its sustainability, or the mere fact that concludes if the product is going to satisfy the product it is intended to.
The male respondent used their black hats as their 5th hat. Thus, concentrating on the negative sides that the product might have or might poses. And use green hats as their 6th hats, a hat that focuses on imagination, and creativity. For a product that might mean another approach to it other than the traditional approach. Such as using a pair of jeans pant and make it into a bag.
While the female respondents use their creativity in the 5th step and focus on the bad sides of the product at the last step.
The reason this method is better than the existing method:
Helps in value proposition
Reaches every customer. Takes every customer’s satisfaction in minds.
While other consumer theories are heavily dependent on external factors, this drives an individual’s core values to desired direction. So, the chance of any sudden change is unlikely to happen.
With AWS and Google and different media like TV, magazines, apps, portals, newspaper, Streaming services, and different events, the cost of marketing exceeds the desired level. This method minimizes the marketing cost.
In the digital advertisement system there are lots of 3rd parties included. This method helps reducing them.
The new advertisement system, with Google algorithm, YouTube algorithm has been accused of invasion of privacy. This method does not invade and collect customers’ actual data indirectly without breaking their privacy.
Conclusion👇
This survey helps in understanding the decision-making process of consumers, while segregating them. It helps to capture more customers with smaller frames to look at. The study can be used to help in increasing sell, thus to increase the GDP of Bangladesh and helping this country to be on solid ground. The scope of using this method can help pick up the present situation. So, there is a lot of ways open to research of worker movements in each department of textile industries. Also, others research can be done in practical implementation of proposed method and finding the challenges, obstacles and changes if required any. The study can be done in a broader spectrum with respondents of the intended buyer countries respondent, mostly Europe and USA.
Disclosure of Statement: In accordance with journal policy and my ethical obligation as a researcher, I am reporting that I have no financial or business or any kind of competing interests in the enclosed paper.
References:
[1] C. Market, “IBTEX No. 217 of 2019 November 08, 2019,” vol. 6, no. 217, pp. 1–35, 2019.
[2] F. D. Investment, E. P. Zones, P. Zone, and T. Epzs, “2 . Garments Industries in Bangladesh :,” pp. 1–21, 1993.
[3] S. Improvement, “Six Thinking Hats ® Online library of Quality, Service Improvement and Redesign tools.”
[4] G. P. Dinesh, “Asian journal of management research,” Asian J. Manag. Res., vol. 2, no. 2, pp. 814–820, 2012.
[5] E. De Bono, “Six Thinking Hats: An Essential Approach to Business Management. Little, Brown, & Company (Ed),” Open J. Soc. Sci., 1985.
[6] “Visual Program Online.”
[7] P. Mulder, “Six Thinking Hats,” 2011.
[8] D. McGregor, Developing thinking ; developing learning : a guide to thinking skills in education. 2007.
[9] F. P. Mongelli, “European Economic and Monetary Integration and the Optimum Currency Area Theory,” 2008. doi: 10.2765/3306.
[10] Edward de Bono, Six Thinking Hats, Revised an. Back Bay Books, 1999.


 in Bangladesh Apparel Industry")


 in Bangladesh Apparel Industry")


2 thoughts on “Six Thinking Hats | Investigating the Consumers’ Buying Behaviors”