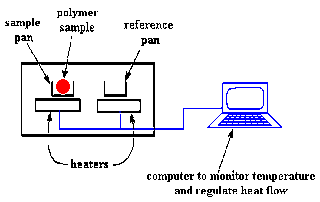
Differential Scanning Calorimetry (DSC) is a thermal analysis technique in which the heat flow into or out of a sample is measured as a function of temperature or time, while the sample is exposed to a controlled temperature program. It is a very powerful technique to evaluate material properties such as glass transition temperature, melting, crystallisation, specific heat capacity, cure process, purity, oxidation behaviour, and thermal stability.
Construction
There are two pans. In one pan, the sample pan, you put your polymer sample. The other one is the reference pan. You leave it empty. Each pan sits on top of a heater. Then you tell the nifty computer to turn on the heaters. So the computer turns on the heaters and tells it to heat the two pans at a specific rate, usually something like 10ºC per minute. The computer makes absolutely sure that the heating rate stays exactly the same throughout the experiment.
Sample Preparation:
👉Step-1: cut the sample into small pieces like powder.
👉Step-2: Measure the sample (about 5 mg).
👉Step-3: Put the sample into the small aluminium tube and close the tube by the sample tube pressing machine.
Testing Procedure:
At first a known reference sample is being tested to check the machine reading (calibration) and then the specimen is tested accordingly.
👉Step-1: At the very beginning start the UPS and then press ON button of DSC machine.
👉Step-2: Open the DSC software from the desktop after showing “Ready” in the display of DSC heating machine.
👉Step-3: Click on “PYRIS” shortcut from desktop after seeing “Waiting for link” in the DSC display board.
👉Step-4: Click on PYRIS menu to open it and will come 4 tabs as (i) sample information, (ii) initial state (iii) program and (iv) view program.
👉Step-5: Click on “Sample Information” Tab and write (i) the sample ID as : date-space-Indium (ii) Weight: 8.3mg (reference Indium wt) (iii) File name as same as the sample id. Then put the Indium sample into the DSC heating chamber.
👉Step-6: Click on “Initial State” Tab and write the initial temperature in the box same as the room temperature shown above.
👉Step-7: Click on “Program” Tab and fill up (i) initial temperature, (ii) ending temperature [standard melting temperature of the sample + approx. 50ºCand (iii) rate [normally 10ºC/min]
👉Step-8: Click on “View Program” Tab and recheck the program going to be given.
👉Step-9: Confirm N2 gas flow as 50ml/min from the view program tab and open the gas cylinder. Then check the gas flow accordingly into the DSC machine from the right side indicator ball.
👉Step-10: DSC Display will show “Ready” and click on the “START” menu from the desktop PYRIS Program. After the test stop the program and then N2 gas cylinder.
👉Step-11: Finally open the DSC heating chamber and put out the sample. After that wait until the chamber temperature comes down below approx. 50ºC.
👉Step-12: Don’t close any windows as specimen is yet to test. Then put the specimen into the DSC heating chamber if it comes down to the suitable temperature and click on “Method Editor” from the desktop.
👉Step-13: By the same way, execute the test for the specimen as well.
Graph Measurements:
👉Step-1: Calculate the peak’s measurement from the graph as: click on “Calc” à click on “Peak Area” a will come a dialogue box and tick (i) onset (ii) End (iii) Peak Height box à select the “Peak starting & ending point by mouse clicking and dragging”à click on “calculate” button.
👉Step-2: Now get the required data for the reference indium sample. And from these data we can come to understand about the machine calibration.
👉Step-3: Create a folder at the desktop and write the folder name same as the sample id. Then put the below data into this folder : (i) Test Program detail information (ii) images (iii) Data information and (iv) ASCII data.
- Test Program detail information: My computer à C-drive à Program files à Pyris à Data à Sample ID (Copy this sample id file and paste into the desktop folder).
- Images: Open a new blank doc file in the desktop folder à graphà edità copy imageà paste in the doc file.
- Data information: click on “Tools”à Tableà Curve Tables à write to file à Desktop folder à File name (ASCII Indium).
- ASCII data: Open the graphà Fileà Export Dataà ASCIIà Will come a “Create Text file” dialogue boxà select both the blank boxà My computerà C driveà Program filesà Pyrisà Dataà Sample ID text file (Cut this sample id file and paste into the desktop folder).
Applications:
- Purity,
- Thermal Stability,
- Dehydration of inorganic substances,
- Phase Transitions,
- Decomposition Temperature, Glass Transition Temp, Melting Temp, Crystallisation Temp and Crystallisation rates etc.
Texpedi.com
Check out these related articles:


