Fourier Transform-Infrared Spectroscopy (FTIR) is an analytical technique used to identify organic (and in some cases inorganic) materials. This technique measures the absorption of infrared radiation by the sample material versus wavelength. The sample’s absorbance of the infrared light’s energy at various wavelengths is measured to determine the material’s molecular composition and structure.
How FTIR Works:
A simple device called an interferometer is used to identify samples by producing an optical signal with all the IR frequencies encoded into it. The signal can be measured quickly. Then, the signal is decoded by applying a mathematical technique known as Fourier transformation. This computer-generated process then produces a mapping of the spectral information. The resulting graph is the spectrum which is then searched against reference libraries for identification.
With the microscope attachment, samples as small as 20 microns can be analyzed. This allows quick and cost effective identification of unknown particles, residues, films or fibers. FTIR can also measure levels of oxidation in some polymers or degrees of cure in other polymers as well as quantifying contaminants or additives in materials.
Testing Process:
👉Step 1: Place sample in FTIR spectrometer. The spectrometer directs beams of IR at the sample and measures (1) how much of the beam and (2) at which frequencies the sample absorbs the infrared light. The sample needs to be thin enough for the infrared light to transmit through, or a thin slice of the material must be removed. Reflectance techniques can be used on some samples and no damage is done to the sample. Samples conducive to reflectance are residues, stains or films on a fairly flat reflective surface or somewhat pliable materials that are thin enough to fit under the microscope using the attenuated total reflectance attachment to the microscope.
👉Step 2: The reference database houses thousands of spectra, so samples can be identified. The molecular identities can be determined through this process.
How to Read FTIR Results Graphs?
👉The X-Axis: The Infrared Spectrum
The x-axis—or horizontal axis—represents the infrared spectrum, which plots the intensity of infrared spectra. The peaks, which are also called absorbance bands, correspond with the various vibrations of the sample’s atoms when it’s exposed to the infrared region of the electromagnetic spectrum. For mid-range IR, the wave number on the infrared spectrum is plotted between 4,000 to 400 cm-1.
👉The Y-Axis: Absorbance or Frequency
The y-axis—or vertical axis—represents the amount of infrared light absorbed or transmitted by the material being analyzed.
The Absorbance Bands:
Typically, absorbance bands are grouped within two types:
- Group frequencies and
- Fingerprint frequencies.
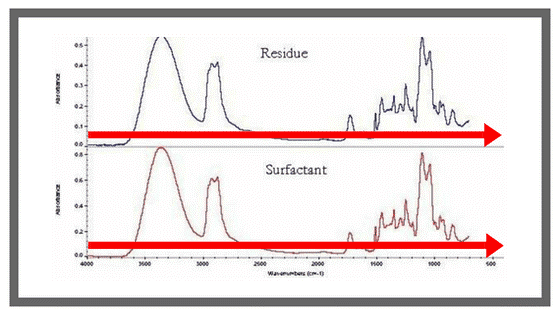
Group frequencies are characteristic of small groups of atoms or functional groups such as CH₂, OH, and C=O. These types of bands are typically seen above 1,500cm-1 in the infrared spectrum (See top spectrum in the graph below) and they’re usually unique to a specific functional group, making them a reliable means of identifying functional groups in a molecule.
As for fingerprint frequencies, these are highly characteristic of the molecule as a whole; they tell what is going on within the molecule. These types of absorbances are typically seen below 1500cm-1 in the infrared spectrum (See bottom graph of figure below); however, some functional groups will absorb in this region as well. As a result, this region of the spectrum is less reliable for identification, but the absence of a band is often more indicative than the presence of a band in this region.
How to Interpret FTIR Spectra?
Once the initial testing and spectrum collection is complete, interpretation of FTIR spectra comes next. Typically, interpreting FTIR spectra starts at the high frequency end to identify the functional groups present. The fingerprint regions are then studied to positively identify the compound. Thankfully, there are vast libraries of infrared spectra available, allowing us to compare unknown materials to ensure quick and accurate identification.
What is the difference between IR and FTIR spectroscopy?
IR used monochromatic light whereas FTIR used polychromatic light. FTIR scans up to 50 times in a minute and giving better resolution. In FTIR, all analytes can be identified with a single measurement and the interferences are resolved.
👉1. Attenuated Total Reflectance (ATR)
At a particular angle of incidence, almost all of the light waves are reflected back. This phenomenon is called total internal reflection. It is a sampling technique used in conjunction with infrared spectroscopy which enables samples to be examined directly in the solid or liquid state without further preparation. ATR uses a property of total internal reflection resulting in an evanescent wave. we can analyze a wide variety of solids and some liquids (dependent upon crystal material) using this technique.
👉2. Specular Reflectance (SR)
Specular Reflectance typically occurs from bulk samples with a glossy surface such as crystal faces, glasses, and monolithic polymers. Absorbance spectra may be obtained from specular reflection data using the Kramers-Kronig transform if the sample is homogeneous, optically thick, and if spectra are collected at a nearly normal incidence.
[Spectral measurement can be made easily using specular spectrometry without destroying the sample. However, when it is applied to the measurement of a sample which is highly specular like a glassy or crystalline substance and which exhibits absorption in the infrared region, abnormal dispersion occurs, making the peaks of the spectrum distorted to look like those of a first derivative curve. From such a spectrum, analysis and identification of functional groups is difficult. Therefore this distorted spectrum needs to be transformed into an ordinary spectrum for interpretation. The Kramers-Kronig transform is used for that purpose.]
👉3. Reflection-Absorption (RA)
Reflection absorption occurs when thin films are present on a reflective substrate. Samples such as thin polymer films, residues and paints are suitable for reflection-absorption measurements, if they are present as an over layer on a reflective substrate.
👉4. Transmission (TR)
Transmission spectroscopy involves passing infrared radiation completely through a sample and measuring the extent of absorption. Consequently, significant sample preparation may be required as concentration, thickness, homogeneity and particle size must all be considered. This technique is suitable for sampling gases, liquids, and solids (fibers, microtome cuts, thin films, pressed pellets, and mulls).
👉5. Photoacoustic (PA)
Photoacoustic spectroscopy (PAS) can be quite complex and difficult to perform. The photoacoustic signal is generated when the infrared radiation absorbed by a sample is converted to heat within the sample. This heat diffuses to the sample surface and into the adjacent gas atmosphere. The thermal expansion of this gas produces the photoacoustic signal.
Applications:
– Suitable for solid, liquid, gas and solution sample,
– Location and condition of bonds in a structure,
– Whether aromatic or aliphatic (organic or inorganic) materials.

Texpedi.com
Check out these related articles:


