Raman spectroscope is one of the popular characterisation tools for textile testing especially textile materials characterisation.
Working Principles: It is based upon the interaction of light with the chemical bonds within a material. Raman is a light scattering technique, whereby a molecule scatters incident light from a high-intensity laser light source. Most of the scattered light is at the same wavelength (or colour) as the laser source and does not provide useful information – this is called Rayleigh Scatter. However, a small amount of light (typically 0.0000001%) is scattered at different wavelengths (or colours), which depend on the chemical structure of the analyte – this is called Raman Scatter.
Working Principles: It is based upon the interaction of light with the chemical bonds within a material. Raman is a light scattering technique, whereby a molecule scatters incident light from a high-intensity laser light source. Most of the scattered light is at the same wavelength (or colour) as the laser source and does not provide useful information – this is called Rayleigh Scatter. However, a small amount of light (typically 0.0000001%) is scattered at different wavelengths (or colours), which depend on the chemical structure of the analyte – this is called Raman Scatter.
Applications:
– Vibrational, rotational and other states in molecules,
– Chemical composition and structure of samples,
– Whether solid, liquid, gas, gel or powder.
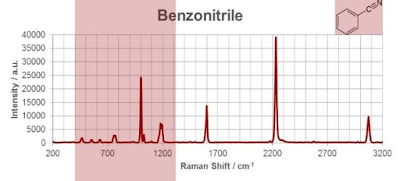
Graph: A Raman spectrum features a number of peaks, showing the intensity and wavelength position of the Raman scattered light. Each peak corresponds to a specific molecular bond vibration, including individual bonds such as C-C, C=C, N-O, C-H etc.
Interpretation of Raman Spectra:
Method-1: By identifying functional groups within molecules:
The vibrations of certain distinct subunits of a molecule called its functional groups will appear in a Raman spectrum at characteristic Raman shifts. Such a shift is similar for all molecules containing the same functional group. These signals are particularly useful when monitoring reactions which involve these functional groups (oxidation, polymerization, etc.) since they provide a direct measure of the progress during the reaction. Using these characteristic shifts make it possible to relate the spectrum of an unknown compound to a class of substances, for example, the stretching vibration of the carbonyl group in an aldehyde is always in the range of 1730 cm–1 to 1700 cm–1. Below figure demonstrates the Raman spectrum of benzonitrile containing the stretching vibration of the cyano-group (CN) of benzonitrile at a characteristic value of 2229.4 cm-1.
Method-2: Using the characteristic “fingerprint region”
Apart from the molecular vibrations of specific functional groups, vibrations of the molecular scaffolding (skeletal vibrations) can be detected in a Raman spectrum. Skeletal vibrations are usually found at Raman shifts below 1500 cm–1 and have a substance-specific, characteristic pattern. This region often referred to as the “fingerprint” region of a substance is the most important part of the spectrum for identification purposes.
Method-3: With computer-aided interpretation software
Substance identification using Raman spectroscopy is nowadays carried out by using software containing a comparison algorithm and a spectral database. The result is shown as a matching factor – the Hit Quality Index (HQI). This factor ranges from 0 (for “no match”) to 100 (for “exact match”). The user may then define a threshold down to which the HQI is interpreted as a match. In this way, substance identification is possible within seconds and non-technical users can easily interpret the results.
Texpedi.com
Check out these related articles:


