To understand the fabric behaviour under tensile load, a generalized load–elongation behaviour of woven fabric is shown in figure 2. The curve consists of three distinct regions. Initial (OA) dominated by frictional restraint, followed by AB (decrimping region) and, finally, BC leading to yarn extension.
Region 1 (OA): The initial part of the curve, is dominated by interfibre friction (usually very small), that is, the frictional resistance due to thread (yarn) bending.
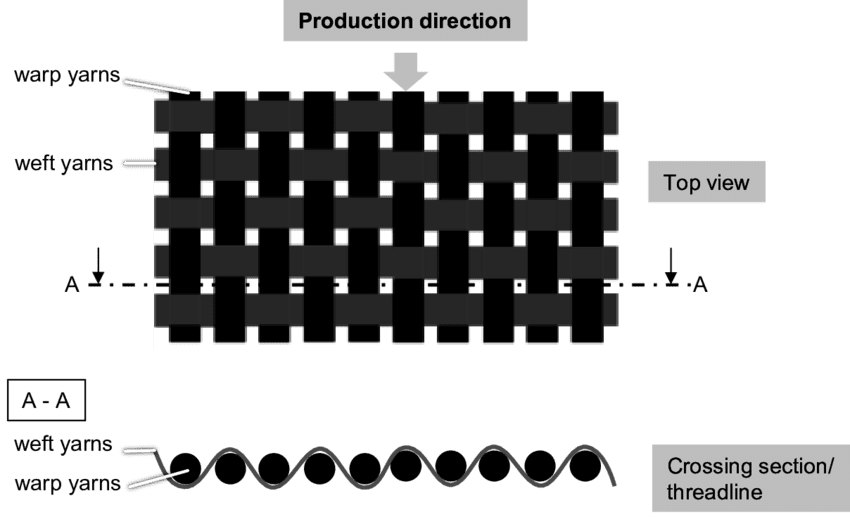 |
| Figure 1. Woven Fabric Structure |
Region 2 (AB): A region of lower modulus, is the decrimping region resulting from the straightening of the thread set in the direction of application of the load, with the associated increase in crimp in the direction perpendicular to the thread direction. This is commonly referred to as ‘crimp interchange’.
Region 3 (BC): The last part of the load-extension curve, is due to yarn extension, i.e. tensile loading of threads in the direction of stress. As the crimp is decreased, the magnitude of the loading force rises very steeply, and as a result, the fibres themselves begin to be extended.
 |
| Figure 2. A generalized load–elongation behaviour of woven fabric |
In summary, in this final region, the load-extension properties of the fabric (cloth) are basically governed by the load-extension properties of the threads or the fibres. This is clearly a region of higher modulus.
Fabric Bending Properties: Hysteresis
An innovative instrument was designed and developed by Livesey and Owen to study the bending behaviour of fabrics. The fabric was uniformly bent in both the directions by the application of a couple and the corresponding curvature was observed. A typical bending curve for the fabric is shown in the below Figure 3.
The bending deformation is nonlinear along the curve OABC to curvature K as shown by arrows. The bending recovery is along with CEM; the point D on the x-axis represents non-recovery from bending deformation. The point M on the y-axis shows the negative couple required to straighten the fabric. The negative deformation is shown along with MFG and recovery along GHL. The intercept DH on the x-axis shows non-recovery during the complete cycle of deformation. The intercept LM on the y-axis reveals frictional restraints during the deformation. The area enclosed within the curve is energy loss due to friction and is termed as hysteresis.
Some useful terms from above figure 3 are explained below:
The intercept OD on the curvature axis is called as the residual curvature. In practice it is calculated as half of the intercept HD, to eliminate asymmetry.
Bending recovery percent,
Rb = (KD/OK) x 100
= [(KD + JH)/JK] x 100 and for better result of the curvature, Ky = HD/2.
The coercive couple (mN mm/mm) is the couple required to restore zero curvature, M0 = LM/2. The initial flexural rigidity G1 (mN mm2/mm) is the ratio of the couple to the curvature at A. The elastic flexural rigidity G0 is the mean slope of EF and HB. The final flexural rigidity Gφ is the mean slope of BC and FG.
Texpedi.com
Check out these related articles:


